> ## Documentation Index
> Fetch the complete documentation index at: https://www.adaline.ai/docs/llms.txt
> Use this file to discover all available pages before exploring further.
# Overview
> Watch production traffic, quality, latency, cost, and the health of your improvement loop
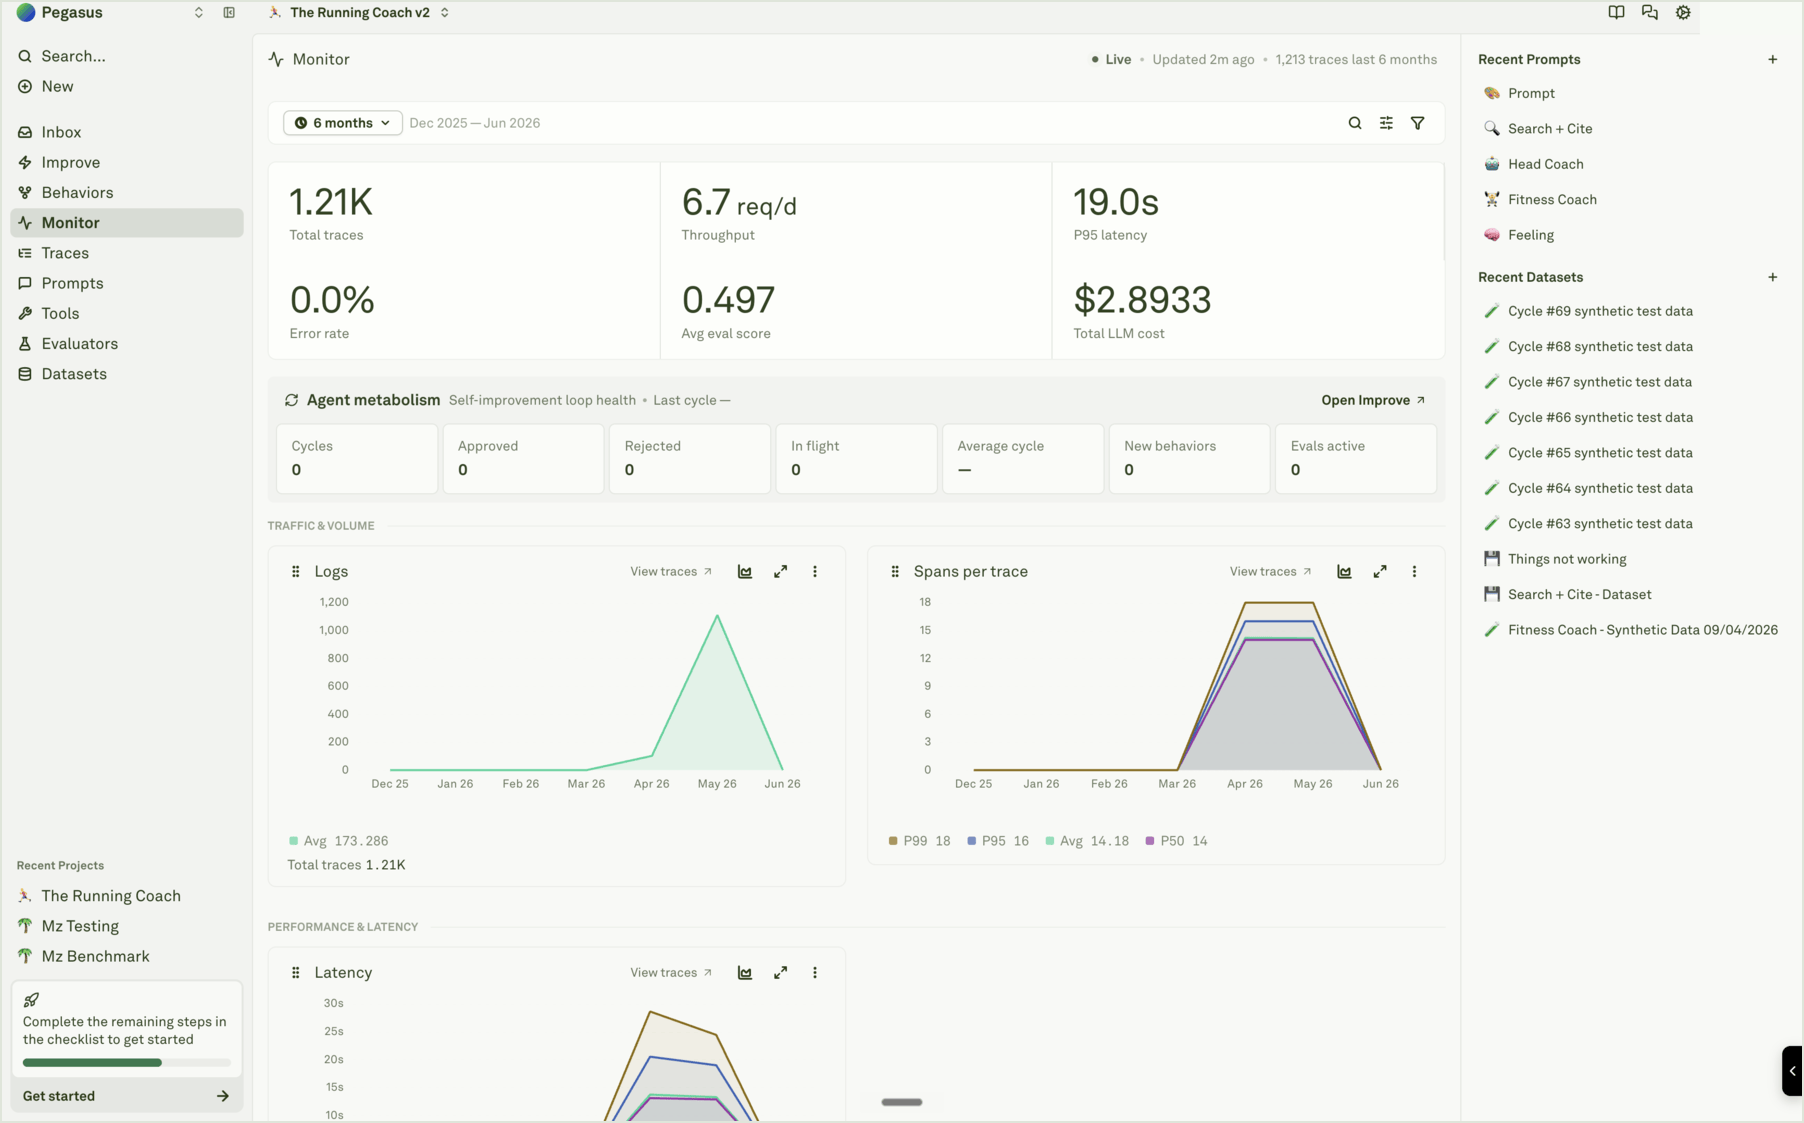
Monitor is the live dashboard for a project. Use it to see whether your AI agent is receiving logs, how traffic is changing, where quality or runtime is drifting, and which evidence needs deeper review in [Traces](/docs/monitor/analyze-log-traces), [Behaviors](/docs/behaviors/overview), [Evaluators](/docs/evaluators/overview), [Datasets](/docs/datasets/overview), or [Improve](/docs/improve/overview).
 ## What Monitor shows
The top of Monitor answers the fastest operational questions:
| Signal | What it tells you |
| ---------------------- | ----------------------------------------------------------------------------- |
| **Total traces** | How much production traffic Adaline has received for the selected time range. |
| **Throughput** | Average request volume over time. |
| **P95 latency** | Tail latency for real user requests. |
| **Error rate** | How often requests are failing. |
| **Average eval score** | Continuous evaluation quality trend, when evaluators are attached. |
| **Total LLM cost** | Provider spend from logged model calls. |
The **Agent metabolism** panel shows the state of the improvement loop: cycles, approved cycles, rejected cycles, in-flight cycles, average cycle time, new Behaviors, and active evals. It is not only a dashboard card. It is a quick answer to "is the agent learning from production or just accumulating logs?"
## Read it as a triage surface
Start broad, then open evidence:
1. Pick the time range that matches the release, incident, or customer report.
2. Scan the KPI row for obvious movement in volume, latency, cost, errors, or eval score.
3. Review the chart groups for the metric that moved.
4. Use **View traces** from a chart, or open [Traces](/docs/monitor/analyze-log-traces), to inspect the exact requests behind the metric.
5. If the pattern repeats, check [Behaviors](/docs/behaviors/overview). If the fix belongs in the prompt, start or review an [Improve cycle](/docs/improve/overview).
Monitor should not be the final stop for important decisions. It points you to evidence, and the evidence should become a trace review, Behavior investigation, dataset row, evaluator update, or Improve cycle.
## Dashboard sections
Monitor groups charts by the kind of decision they support:
| Section | Use it for |
| ------------------------- | -------------------------------------------------------------------------------------------- |
| **Traffic & volume** | Confirm logs are arriving, request volume changed, or spans per trace changed. |
| **Performance & latency** | Find slow requests, tail latency, and bottlenecks before editing prompts. |
| **Quality** | Watch eval score and pass-rate movement across production traffic. |
| **Cost & spend** | Track total cost, tokens, and whether usage changed after a prompt, model, or traffic shift. |
| **Model breakdown** | Compare cost, latency, tokens, and efficiency by model. |
| **Environment breakdown** | Separate production, staging, and other deployment environments when metadata is present. |
| **Performance breakdown** | Identify slow prompts or other high-impact surfaces. |
| **Tool usage** | See which tools or functions are being called and how often. |
For chart details, see [Analyze log charts](/docs/monitor/analyze-log-charts).
## Good Monitor data
Monitor becomes useful when your logs contain clear names, spans, status, input and output content, model usage, costs, tokens, tags, and safe metadata such as environment, route, release, customer segment, or feature flag.
If charts look empty, flat, or hard to segment, the next step is usually instrumentation, not analysis. See [Integrate your AI Agent](/docs/get-started/integrate-your-ai-agent) and [Instrument overview](/docs/instrument/overview).
Read traffic, quality, latency, cost, model, environment, and tool charts.
Move from a metric to the exact traces behind it.
Narrow production traffic, inspect matching traces, and export the result set for review.
Find relevant logs by meaning across traces and spans.
Turn production evidence into datasets, evaluators, and Improve cycles.
## What Monitor shows
The top of Monitor answers the fastest operational questions:
| Signal | What it tells you |
| ---------------------- | ----------------------------------------------------------------------------- |
| **Total traces** | How much production traffic Adaline has received for the selected time range. |
| **Throughput** | Average request volume over time. |
| **P95 latency** | Tail latency for real user requests. |
| **Error rate** | How often requests are failing. |
| **Average eval score** | Continuous evaluation quality trend, when evaluators are attached. |
| **Total LLM cost** | Provider spend from logged model calls. |
The **Agent metabolism** panel shows the state of the improvement loop: cycles, approved cycles, rejected cycles, in-flight cycles, average cycle time, new Behaviors, and active evals. It is not only a dashboard card. It is a quick answer to "is the agent learning from production or just accumulating logs?"
## Read it as a triage surface
Start broad, then open evidence:
1. Pick the time range that matches the release, incident, or customer report.
2. Scan the KPI row for obvious movement in volume, latency, cost, errors, or eval score.
3. Review the chart groups for the metric that moved.
4. Use **View traces** from a chart, or open [Traces](/docs/monitor/analyze-log-traces), to inspect the exact requests behind the metric.
5. If the pattern repeats, check [Behaviors](/docs/behaviors/overview). If the fix belongs in the prompt, start or review an [Improve cycle](/docs/improve/overview).
Monitor should not be the final stop for important decisions. It points you to evidence, and the evidence should become a trace review, Behavior investigation, dataset row, evaluator update, or Improve cycle.
## Dashboard sections
Monitor groups charts by the kind of decision they support:
| Section | Use it for |
| ------------------------- | -------------------------------------------------------------------------------------------- |
| **Traffic & volume** | Confirm logs are arriving, request volume changed, or spans per trace changed. |
| **Performance & latency** | Find slow requests, tail latency, and bottlenecks before editing prompts. |
| **Quality** | Watch eval score and pass-rate movement across production traffic. |
| **Cost & spend** | Track total cost, tokens, and whether usage changed after a prompt, model, or traffic shift. |
| **Model breakdown** | Compare cost, latency, tokens, and efficiency by model. |
| **Environment breakdown** | Separate production, staging, and other deployment environments when metadata is present. |
| **Performance breakdown** | Identify slow prompts or other high-impact surfaces. |
| **Tool usage** | See which tools or functions are being called and how often. |
For chart details, see [Analyze log charts](/docs/monitor/analyze-log-charts).
## Good Monitor data
Monitor becomes useful when your logs contain clear names, spans, status, input and output content, model usage, costs, tokens, tags, and safe metadata such as environment, route, release, customer segment, or feature flag.
If charts look empty, flat, or hard to segment, the next step is usually instrumentation, not analysis. See [Integrate your AI Agent](/docs/get-started/integrate-your-ai-agent) and [Instrument overview](/docs/instrument/overview).
Read traffic, quality, latency, cost, model, environment, and tool charts.
Move from a metric to the exact traces behind it.
Narrow production traffic, inspect matching traces, and export the result set for review.
Find relevant logs by meaning across traces and spans.
Turn production evidence into datasets, evaluators, and Improve cycles.