> ## Documentation Index
> Fetch the complete documentation index at: https://www.adaline.ai/docs/llms.txt
> Use this file to discover all available pages before exploring further.
# Filter, search, export logs
> Narrow Monitor logs, inspect the matching traces and spans, and export the result set for review
Use this workflow when Monitor shows a signal but the project has too many logs to inspect row by row. Filter or search the log set, confirm the matching traces and spans, then export the exact evidence if it needs to leave Adaline.
 ## Start from the question
Good filters begin with a specific question:
| Question | Useful starting point |
| ------------------------------------------ | ------------------------------------------------------------------------ |
| Which logs belong to this customer report? | Time range, trace name, reference ID, and safe user or account metadata. |
| What changed after a release? | Environment, deployment, prompt, release tag, and time range. |
| Which requests are slow or expensive? | Latency, cost, tokens, model, prompt, route, and status. |
| Which logs failed quality checks? | Evaluator score, evaluator status, Behavior context, prompt, and status. |
| Which tool path is causing trouble? | Tool or function name, status, tags, attributes, and trace name. |
Filters are only as useful as the metadata you send. If you cannot isolate traffic by environment, release, route, prompt, model, or safe customer segment, improve [instrumentation](/docs/instrument/overview) before using Monitor for incident review.
## Filter and search
Use filters for precise fields such as time range, status, name, tags, attributes, cost, latency, tokens, prompt context, and evaluator context. Use search when you are looking for a term or phrase that may appear in names, inputs, outputs, or metadata.
Use [Deep search](/docs/monitor/deep-search) when you know the meaning of the evidence you want, but not the exact words or metadata. Deep search is better for exploratory questions such as "users trying to cancel but keep old data" or "assistant gives a confident answer without using the right tool."
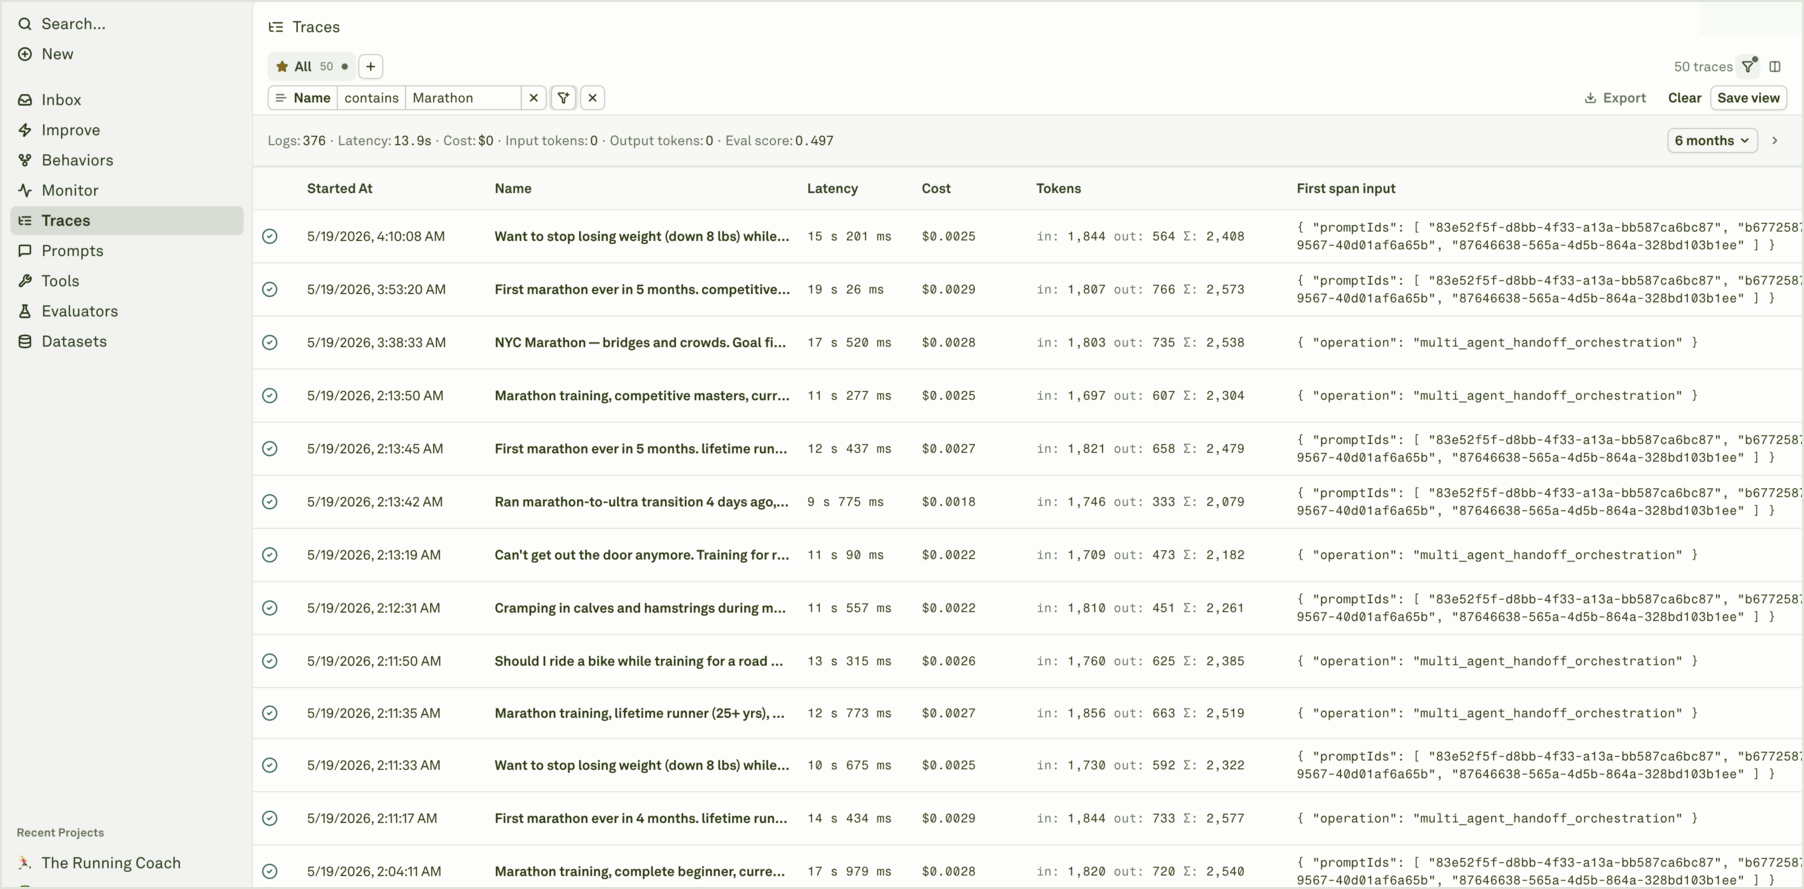
After applying a filter, check the summary row before opening individual traces. The result count, latency, cost, tokens, and eval score tell you whether the filtered set still matches the question.
## Shape the table
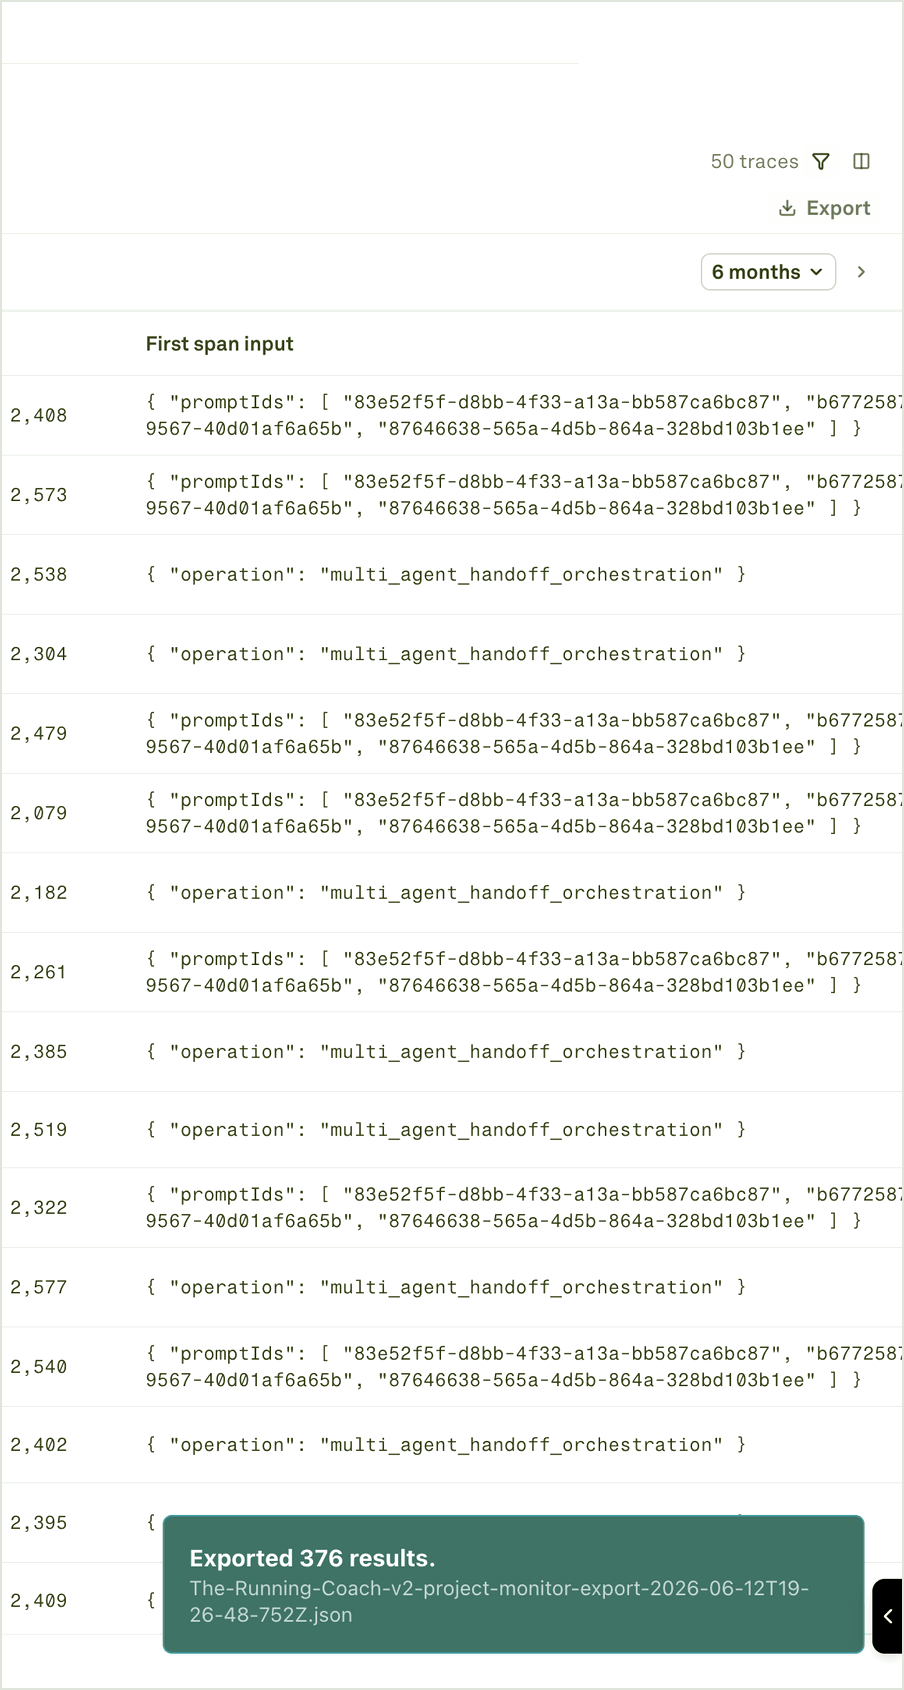
Keep only the columns needed for the investigation. For example, a latency review usually needs started time, name, latency, status, tags, and attributes. A cost review usually needs cost, tokens, model or prompt context, and first span input.
## Start from the question
Good filters begin with a specific question:
| Question | Useful starting point |
| ------------------------------------------ | ------------------------------------------------------------------------ |
| Which logs belong to this customer report? | Time range, trace name, reference ID, and safe user or account metadata. |
| What changed after a release? | Environment, deployment, prompt, release tag, and time range. |
| Which requests are slow or expensive? | Latency, cost, tokens, model, prompt, route, and status. |
| Which logs failed quality checks? | Evaluator score, evaluator status, Behavior context, prompt, and status. |
| Which tool path is causing trouble? | Tool or function name, status, tags, attributes, and trace name. |
Filters are only as useful as the metadata you send. If you cannot isolate traffic by environment, release, route, prompt, model, or safe customer segment, improve [instrumentation](/docs/instrument/overview) before using Monitor for incident review.
## Filter and search
Use filters for precise fields such as time range, status, name, tags, attributes, cost, latency, tokens, prompt context, and evaluator context. Use search when you are looking for a term or phrase that may appear in names, inputs, outputs, or metadata.
Use [Deep search](/docs/monitor/deep-search) when you know the meaning of the evidence you want, but not the exact words or metadata. Deep search is better for exploratory questions such as "users trying to cancel but keep old data" or "assistant gives a confident answer without using the right tool."
After applying a filter, check the summary row before opening individual traces. The result count, latency, cost, tokens, and eval score tell you whether the filtered set still matches the question.
## Shape the table
Keep only the columns needed for the investigation. For example, a latency review usually needs started time, name, latency, status, tags, and attributes. A cost review usually needs cost, tokens, model or prompt context, and first span input.
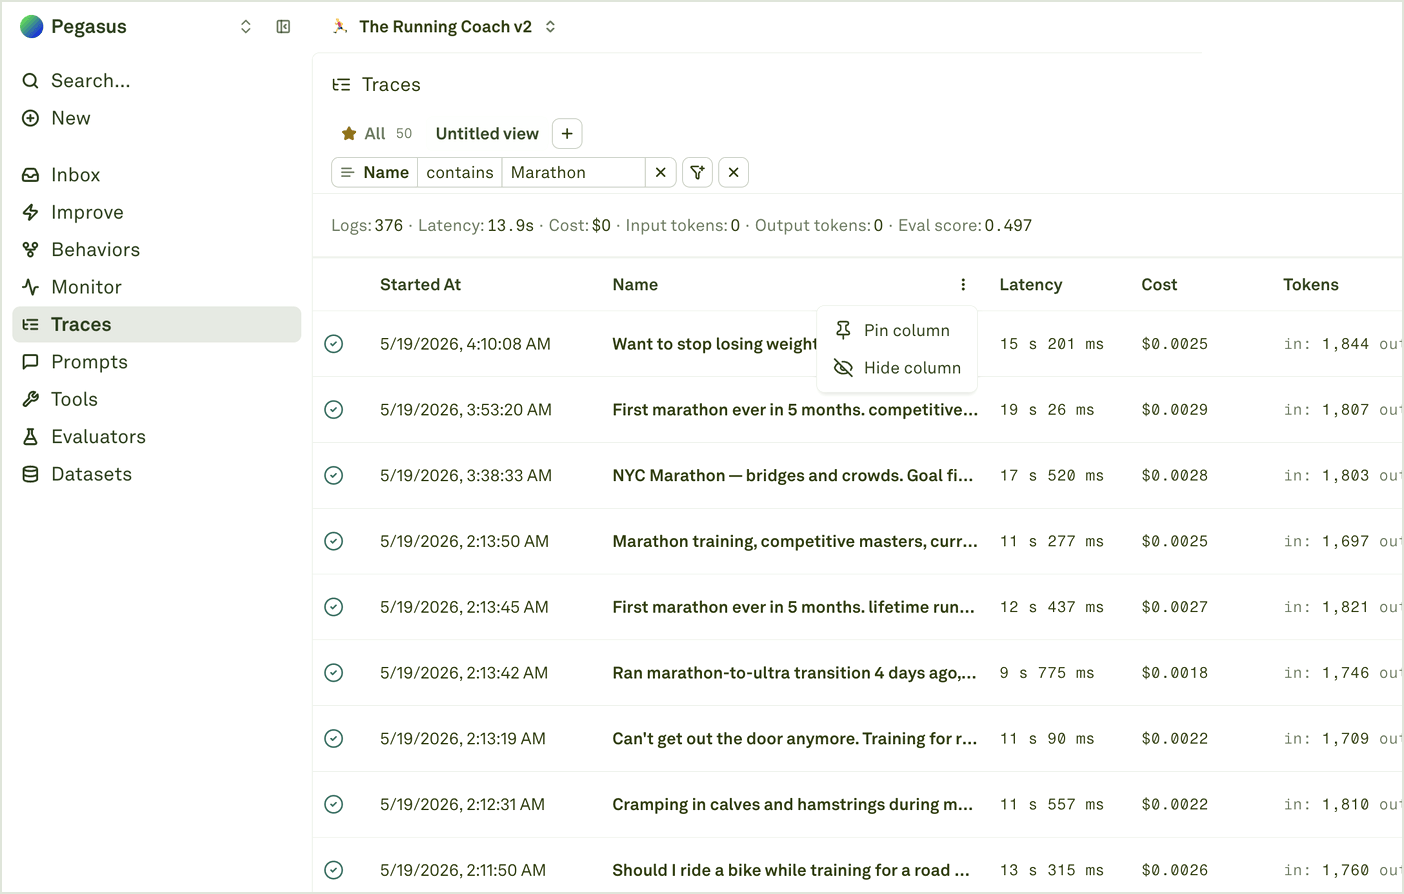
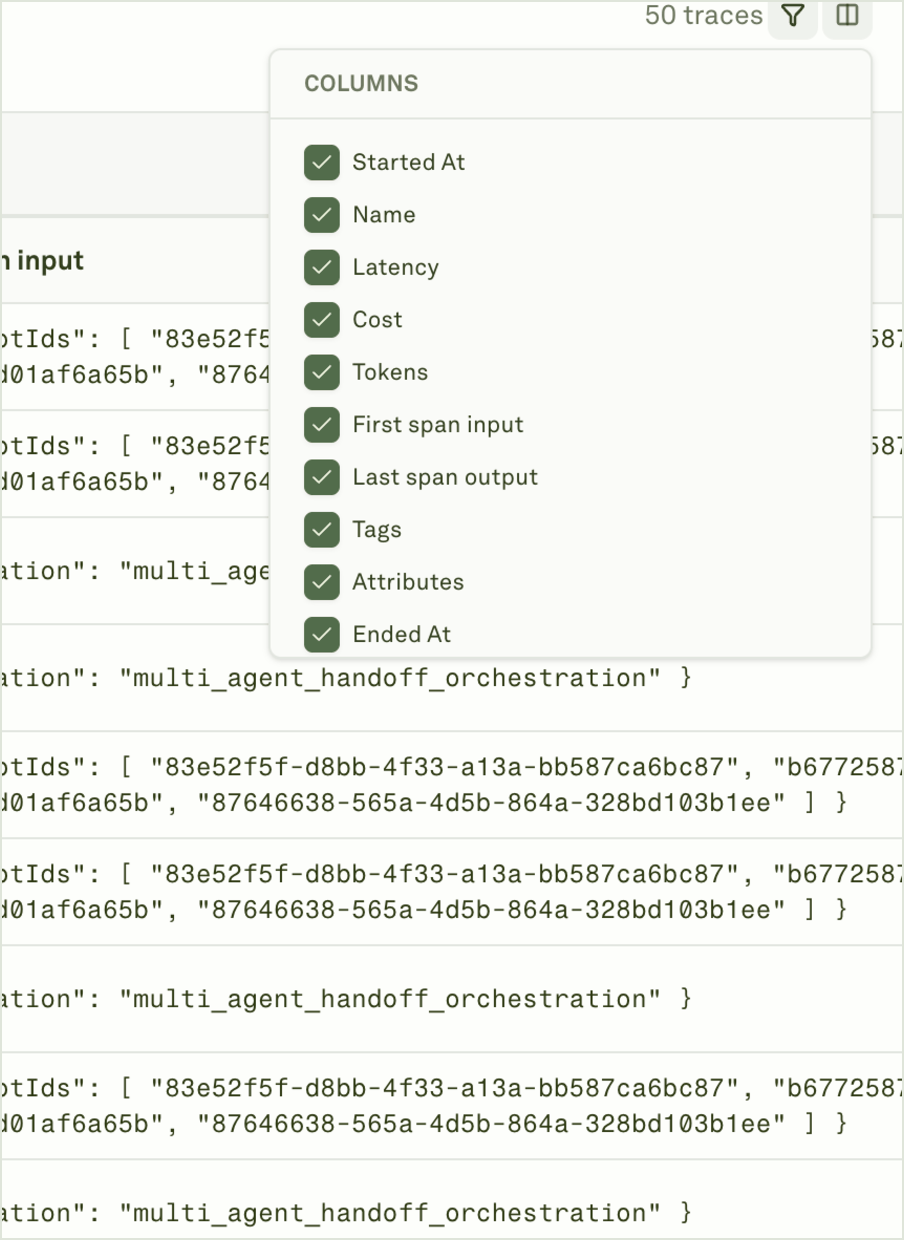 Use the column menu to pin or hide fields while you scan. Open the trace viewer when you need full content, span details, raw payloads, evaluator output, or tool responses.
 ## Save repeatable views
Save a view when the same filter set is useful more than once: production errors, high-cost requests, low eval-score traces after deployment, tool failures, release-window logs, or Behavior-linked examples.
Name the view after the operational question, not the person debugging it.
## Save repeatable views
Save a view when the same filter set is useful more than once: production errors, high-cost requests, low eval-score traces after deployment, tool failures, release-window logs, or Behavior-linked examples.
Name the view after the operational question, not the person debugging it.
 ## Export logs
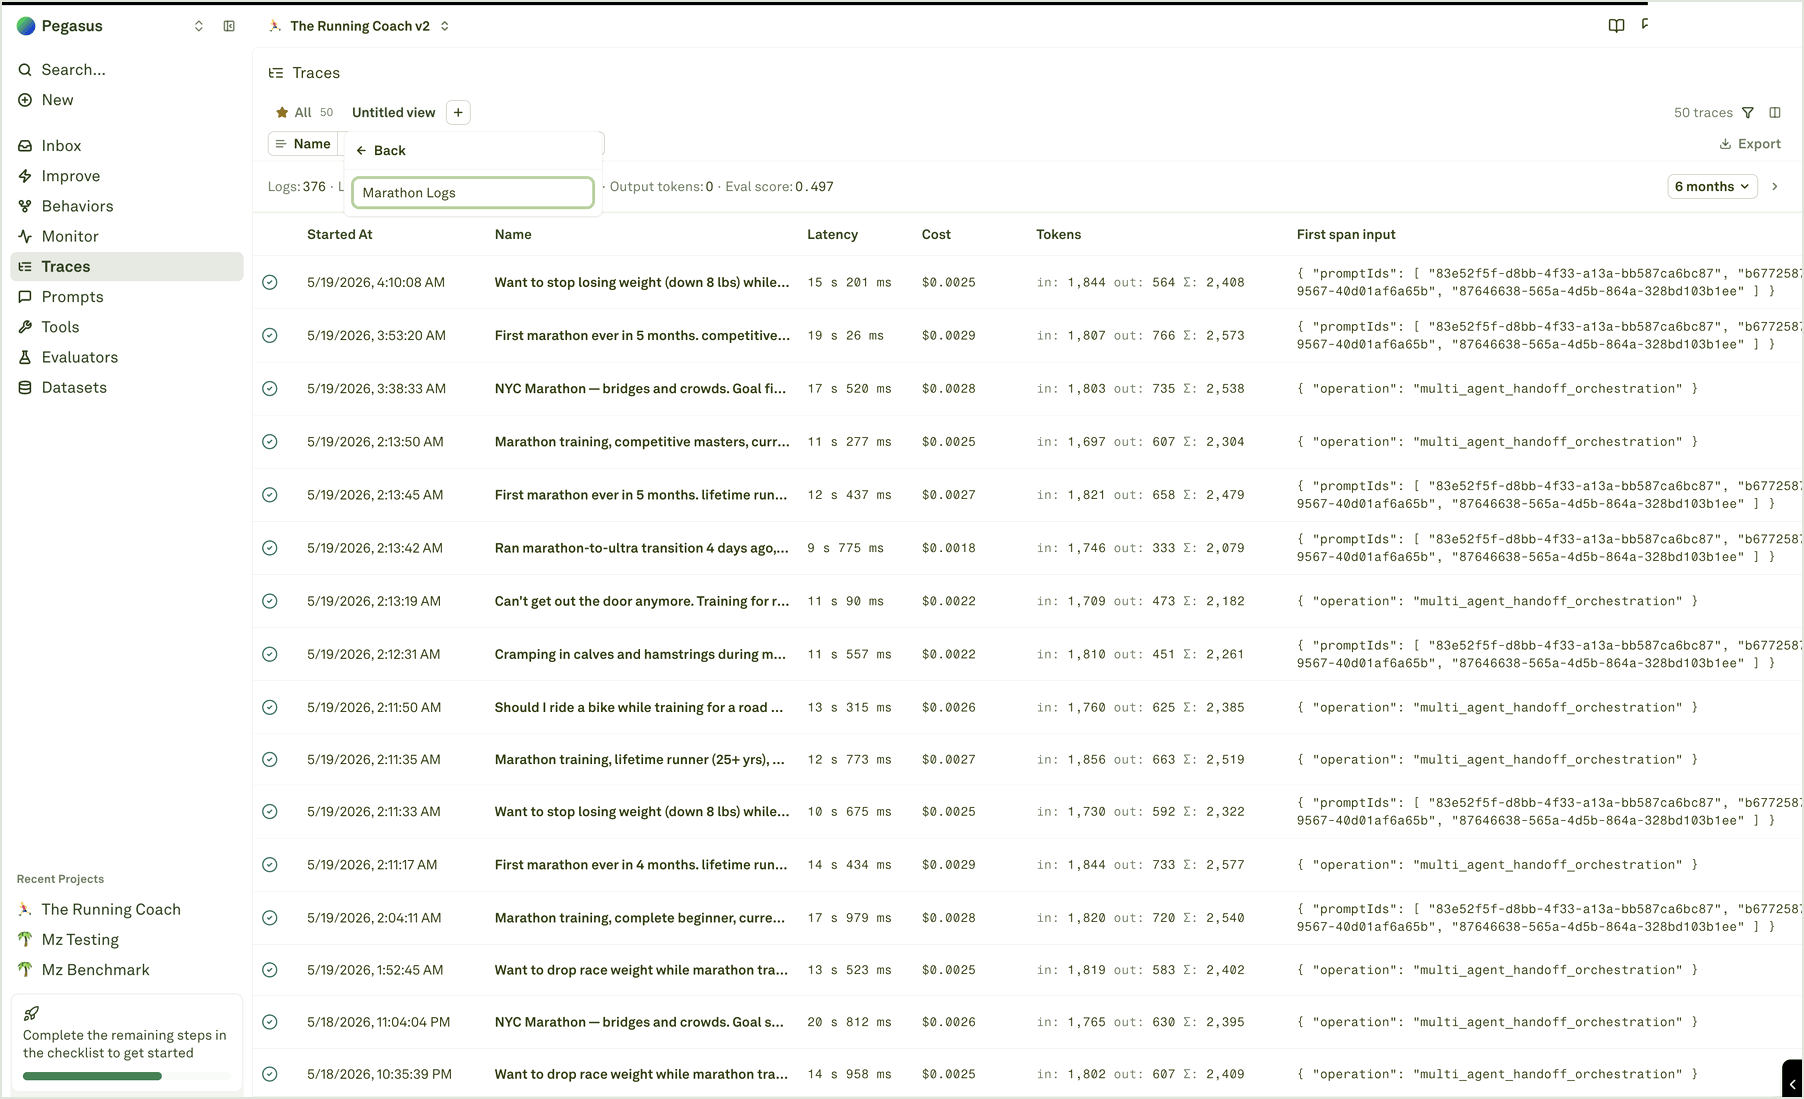
Export the current result set when you need an incident packet, offline analysis, support handoff, or review by another system. The export follows the current filters, so check the time range, filter chips, result count, and visible evidence before downloading.
Trace exports can contain production content, metadata, raw IDs, tool payloads, and model output. Treat exported logs as sensitive data.
## Export logs
Export the current result set when you need an incident packet, offline analysis, support handoff, or review by another system. The export follows the current filters, so check the time range, filter chips, result count, and visible evidence before downloading.
Trace exports can contain production content, metadata, raw IDs, tool payloads, and model output. Treat exported logs as sensitive data.
 Open filtered traces and inspect the spans behind them.
Search logs by meaning when exact filters are not enough.
Start from charts when you need the time window first.
Turn filtered evidence into datasets, evaluators, and Improve cycles.
Open filtered traces and inspect the spans behind them.
Search logs by meaning when exact filters are not enough.
Start from charts when you need the time window first.
Turn filtered evidence into datasets, evaluators, and Improve cycles.