> ## Documentation Index
> Fetch the complete documentation index at: https://www.adaline.ai/docs/llms.txt
> Use this file to discover all available pages before exploring further.
# Analyze log traces
> Move from Monitor signals to exact production traces
Traces are the exact requests behind Monitor. Open them when a chart, customer report, Behavior, evaluator result, or Improve cycle needs proof.
 ## What the table shows
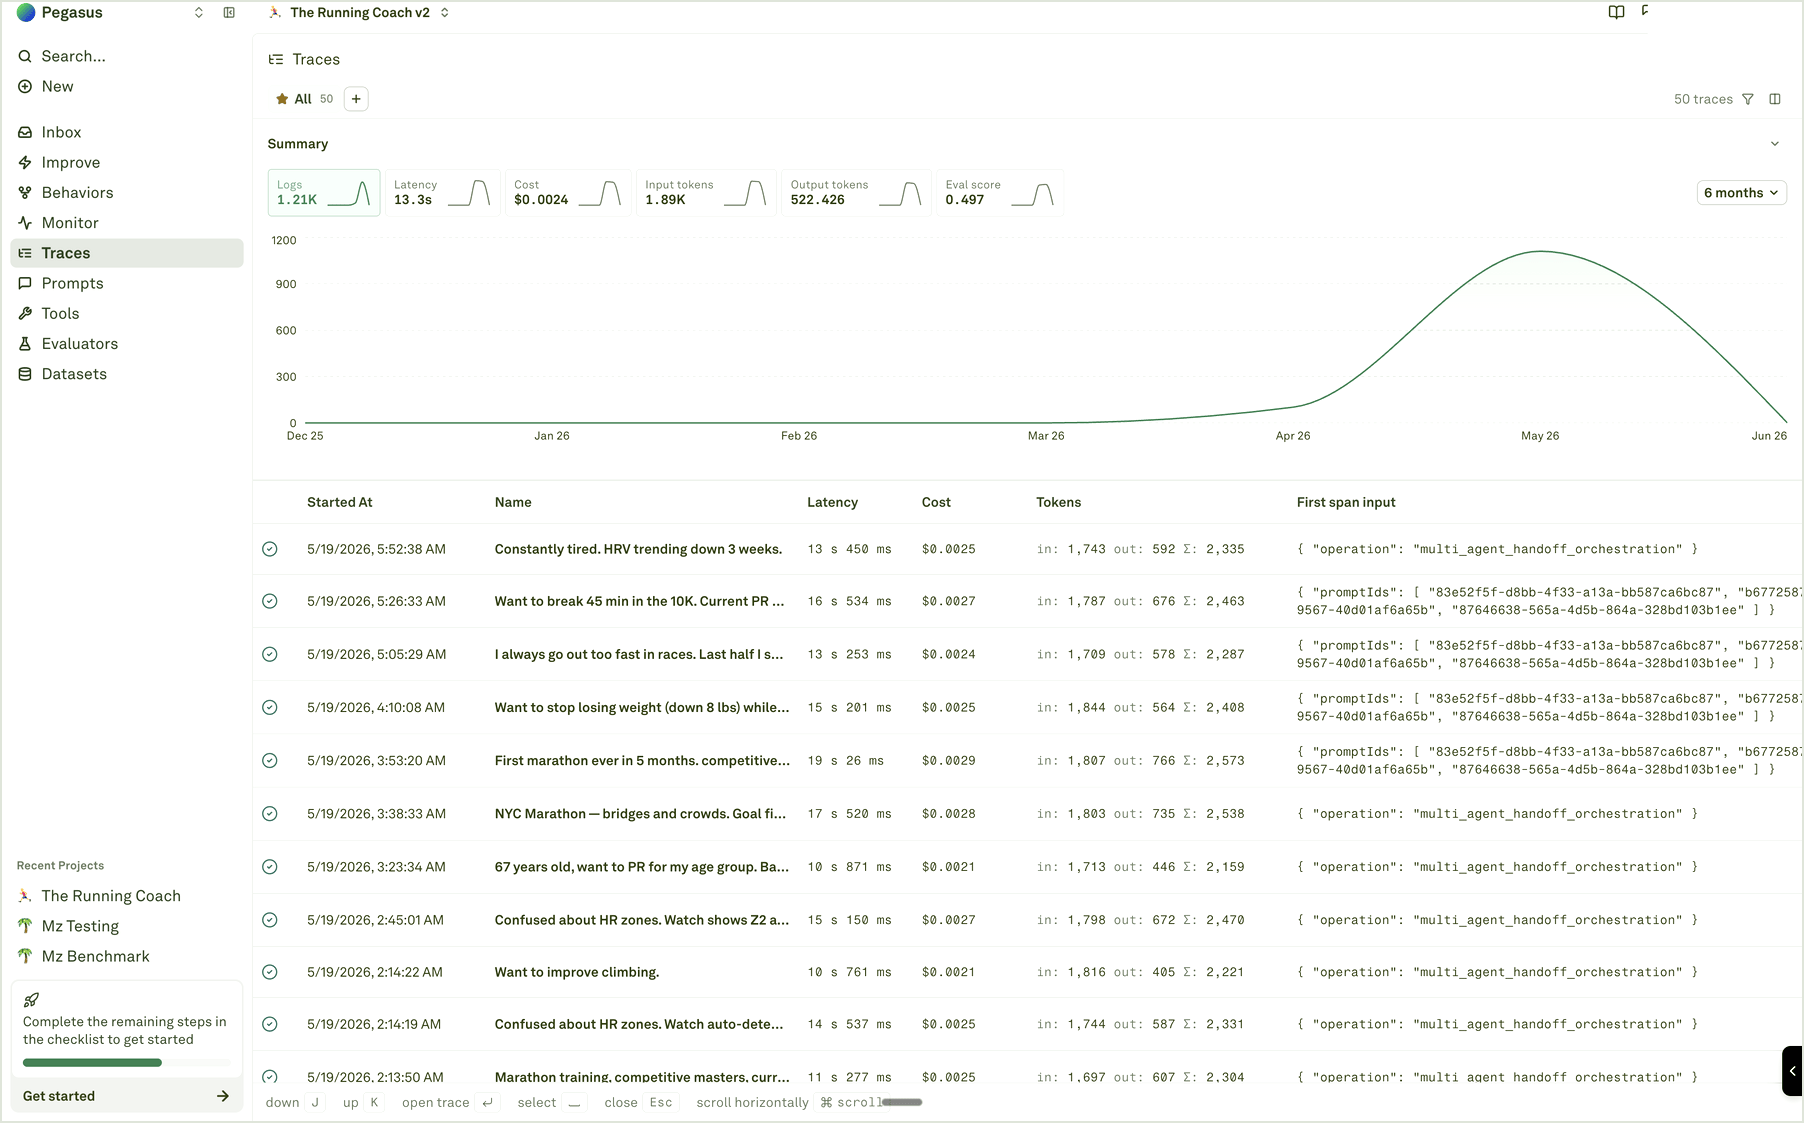
The Traces table gives you enough context to choose the right examples before opening the full trace:
| Column | What to check |
| ----------------------- | -------------------------------------------------------------- |
| **Started At** | Whether the request belongs to the incident or release window. |
| **Name** | The user request, route, workflow, or trace name you sent. |
| **Latency** | End-to-end request time. |
| **Cost** | Provider cost for model calls when available. |
| **Tokens** | Input, output, and total token counts. |
| **First span input** | Quick context from the first logged step. |
| **Tags and attributes** | Metadata used for filtering and investigation. |
Use clear trace names and safe metadata during instrumentation. A table full of generic names is hard to debug even when every request is technically logged.
## What the table shows
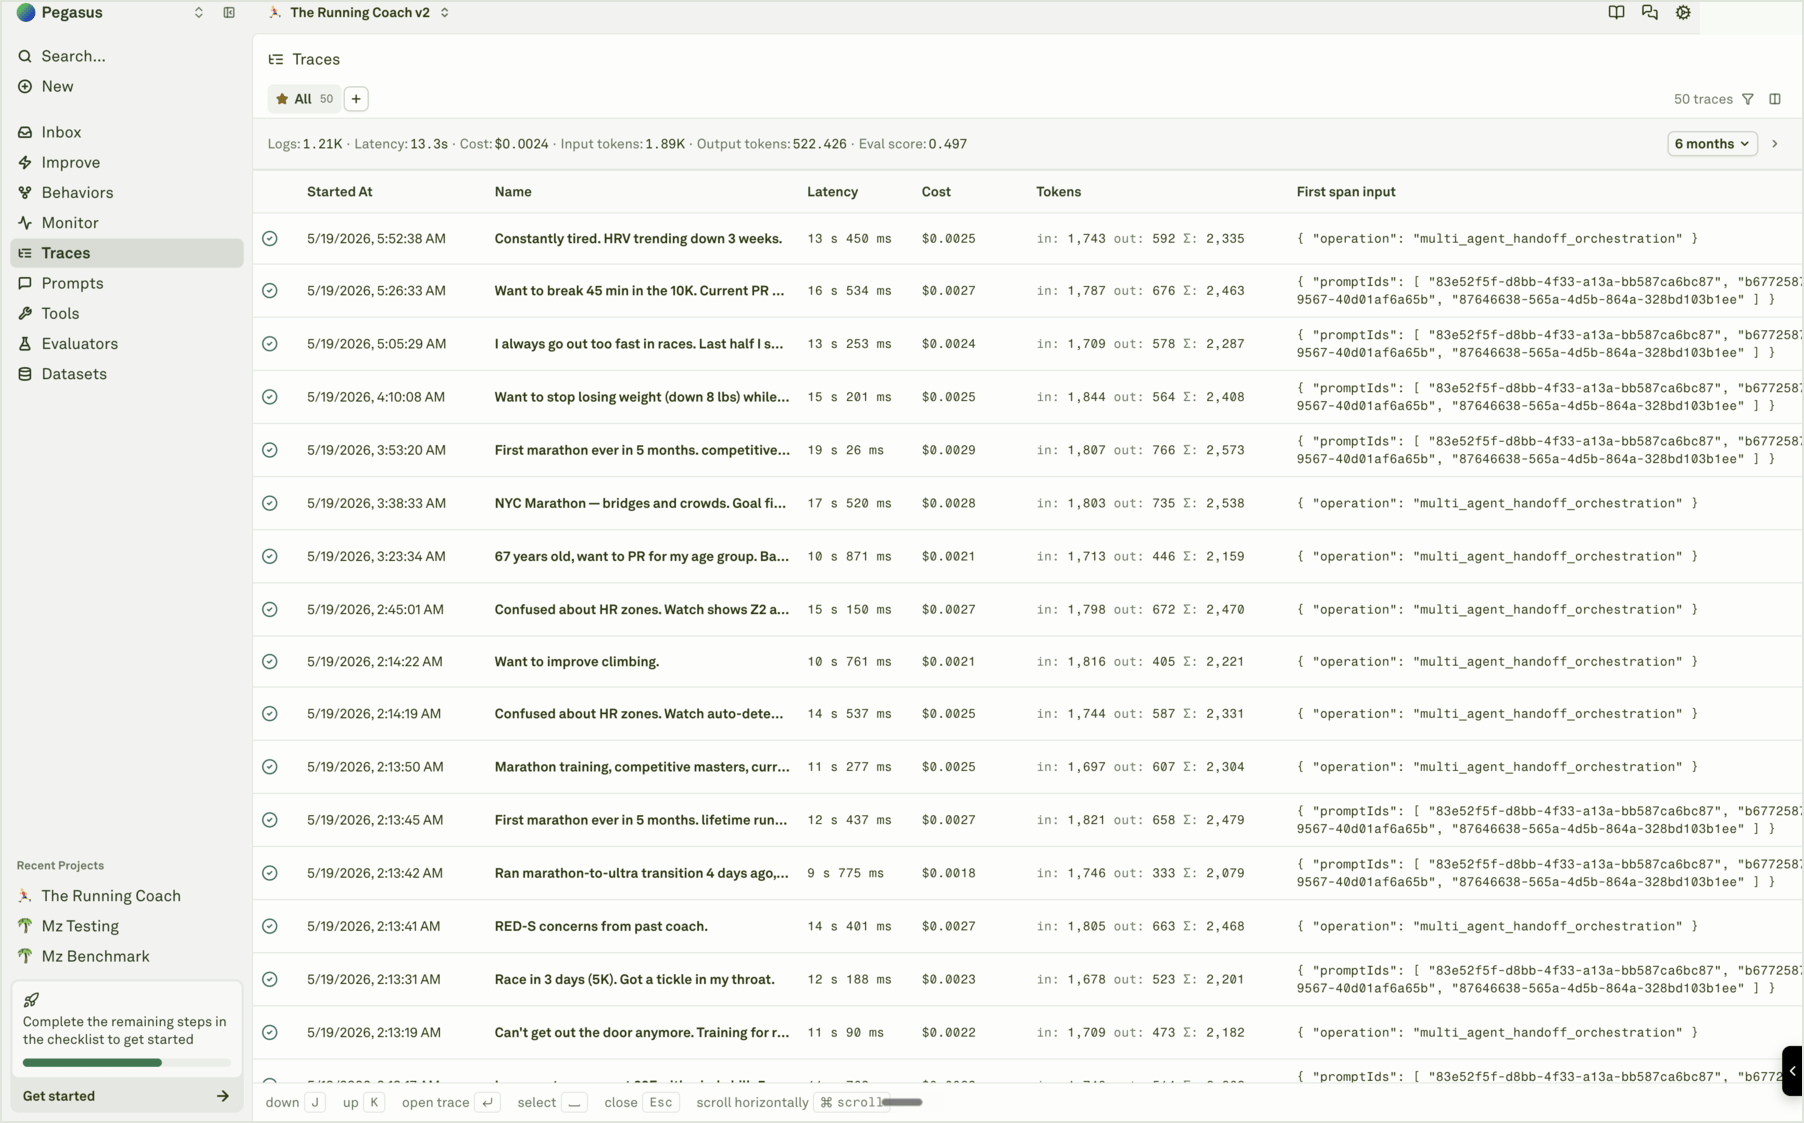
The Traces table gives you enough context to choose the right examples before opening the full trace:
| Column | What to check |
| ----------------------- | -------------------------------------------------------------- |
| **Started At** | Whether the request belongs to the incident or release window. |
| **Name** | The user request, route, workflow, or trace name you sent. |
| **Latency** | End-to-end request time. |
| **Cost** | Provider cost for model calls when available. |
| **Tokens** | Input, output, and total token counts. |
| **First span input** | Quick context from the first logged step. |
| **Tags and attributes** | Metadata used for filtering and investigation. |
Use clear trace names and safe metadata during instrumentation. A table full of generic names is hard to debug even when every request is technically logged.
 ## Open a trace
Select a trace row to open the side sheet. The viewer shows the trace tree, waterfall mode, selected span details, metrics, metadata, raw payload, evaluator results, and actions such as opening a model span in Playground or adding it to a dataset.
Open traces when you need to answer:
* What did the model see?
* What did the final response contain?
* Which tool or function ran?
* Did evaluator results attach to the right span?
* Was the request slow because of one span or several?
* Did metadata, tags, prompt context, or deployment context look correct?
For the full trace viewer workflow, see [Inspect a trace](/docs/monitor/analyze-log-spans).
## Investigate from Monitor
When you arrive from a chart:
1. Keep the same time range.
2. Add one filter that matches the chart signal, such as prompt, model, status, evaluator, cost, latency, tokens, environment, or tool-related metadata.
3. Sort or scan for representative traces.
4. Open a few examples and compare spans.
5. Save useful examples to a dataset or use them as context for Improve.
If the issue is repeated across many traces, check [Behaviors](/docs/behaviors/overview) before hand-picking examples. Behaviors can show whether the same pattern is recurring across production logs.
## Export when evidence needs to leave the app
Use export for incident review, offline analysis, or handoff to another system. Export uses the current filter set, so confirm the filters and result count before sharing the file.
Trace exports can contain production user content, metadata, IDs, tool responses, and model output. Treat them as sensitive data.
Read tree view, waterfall view, span details, and raw payloads.
Narrow the table and export the evidence that matters.
Find similar traces by meaning when names and metadata are not enough.
Turn representative spans into regression coverage.
## Open a trace
Select a trace row to open the side sheet. The viewer shows the trace tree, waterfall mode, selected span details, metrics, metadata, raw payload, evaluator results, and actions such as opening a model span in Playground or adding it to a dataset.
Open traces when you need to answer:
* What did the model see?
* What did the final response contain?
* Which tool or function ran?
* Did evaluator results attach to the right span?
* Was the request slow because of one span or several?
* Did metadata, tags, prompt context, or deployment context look correct?
For the full trace viewer workflow, see [Inspect a trace](/docs/monitor/analyze-log-spans).
## Investigate from Monitor
When you arrive from a chart:
1. Keep the same time range.
2. Add one filter that matches the chart signal, such as prompt, model, status, evaluator, cost, latency, tokens, environment, or tool-related metadata.
3. Sort or scan for representative traces.
4. Open a few examples and compare spans.
5. Save useful examples to a dataset or use them as context for Improve.
If the issue is repeated across many traces, check [Behaviors](/docs/behaviors/overview) before hand-picking examples. Behaviors can show whether the same pattern is recurring across production logs.
## Export when evidence needs to leave the app
Use export for incident review, offline analysis, or handoff to another system. Export uses the current filter set, so confirm the filters and result count before sharing the file.
Trace exports can contain production user content, metadata, IDs, tool responses, and model output. Treat them as sensitive data.
Read tree view, waterfall view, span details, and raw payloads.
Narrow the table and export the evidence that matters.
Find similar traces by meaning when names and metadata are not enough.
Turn representative spans into regression coverage.